


Pupil Premium Spending
This statement details our school’s use of pupil premium (and recovery premium for the 2024 to 2025 academic year) funding to help improve the attainment of our disadvantaged pupils.
It outlines our pupil premium strategy, how we intend to spend the funding in this academic year and the effect that last year’s spending of pupil premium had within our school.
School overview
|
Detail |
Data |
|
School name |
Radwinter CofE Primary School |
|
Number of pupils in school |
137 |
|
Percentage of PPG pupils in school |
7.3% |
|
Academic year/years that our current pupil premium strategy plan covers (3-year plans are recommended) |
2024/2025-2027/2028 |
|
Date this statement was published |
December 2025 |
|
Date on which it will be reviewed |
July 2026 |
|
Statement authorised by |
Emily Bartram – Headteacher |
|
Pupil premium lead |
Emily Bartram – Headteacher Lois Jarrold – Inclusion Leader |
|
Governor / Trustee lead |
Jane Richardson – Disadvantaged Pupil Lead |
Funding overview
|
Detail |
Amount |
|
Pupil premium funding allocation this academic year |
£12,305 |
|
Recovery premium funding allocation this academic year |
£0 |
|
School Led Tutoring funding allocation this academic year |
£0 |
|
Pupil premium funding carried forward from previous years (enter £0 if not applicable) |
£0 |
|
Total budget for this academic year If your school is an academy in a trust that pools this funding, state the amount available to your school this academic year |
£12,305 |
Part A: Pupil premium strategy plan
Statement of intent
|
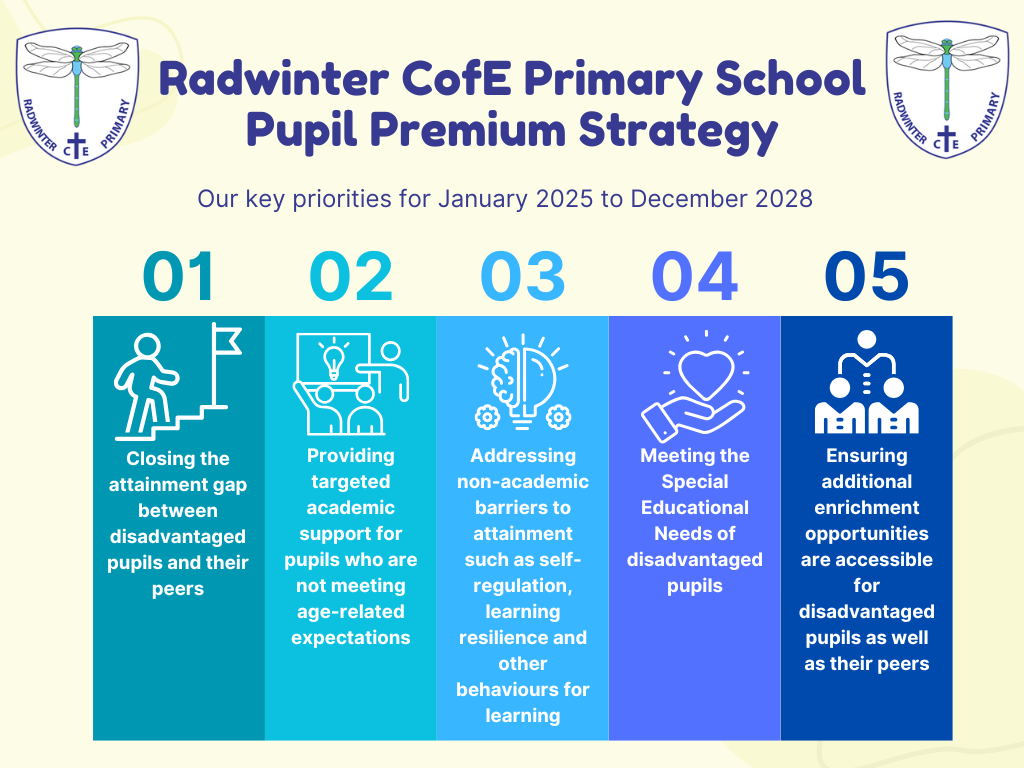
Research shows that the most effective way to reduce inequalities resulting from socio-economic factors is by investing in high-quality, inclusive class teaching, and we believe that setting appropriate learning goals, giving children well-executed, differentiated lessons and constructive feedback, and having high expectations for all pupils, regardless of their personal circumstances, will narrow such an attainment gap. We believe in maximising the use of the pupil premium grant (PPG) by utilising a long-term strategy aligned to the SDP. This enables us to implement a blend of short, medium and long-term interventions, and align pupil premium use with wider school improvements and improving readiness to learn. We also recognise that, in some cases, targeting resources to provide tailored interventions for individuals or groups of children to help them overcome their particular barriers to learning will have a positive impact on learning and achievement, and we recognise, celebrate and build on children’s strengths, to further boost confidence. Overcoming barriers to learning is at the heart of our strategy plan. We understand that needs and costs will differ depending on the barriers to learning being addressed. As such, we do not automatically allocate personal budgets per pupil in receipt of pupil premium funding. Instead, we identify the barriers to be addressed and the interventions required, whether in small groups, large groups, for the whole school or as individuals, and allocate resources accordingly. We aim to help every child at Radwinter CofE Primary School achieve their full potential, and every child’s progress is closely monitored and analysed by staff and governors. Specific data about the attainment of children in receipt of pupil premium funding is looked at separately, along with feedback from children, staff and parents, so that we can identify what is working well and where further support is needed. Setting priorities is key to maximising the use of the PPG. Our priorities are as follows: 1. Closing the attainment gap between disadvantaged pupils and their peers 2. Providing targeted academic support for pupils who are not meeting age-related expectations 3. Addressing non-academic barriers to attainment such as self-regulation, learning resilience and other behaviours for learning 4. Meeting the Special Educational Needs of disadvantaged pupils 5. Ensuring additional enrichment opportunities are accessible for disadvantaged pupils as well as their peers |
Challenges
This details the key challenges to achievement that we have identified among our disadvantaged pupils.
|
Challenge number |
Detail of challenge |
||||||||||||||||
|
1 |
Closing the attainment gap between disadvantaged pupils and their peers In 2025, the number of children achieving age related expectations in core subjects was as follows:
|
||||||||||||||||
|
2 |
Providing targeted academic support for pupils who are not meeting age related expectations In 2024, none of the pupils in receipt of pupil premium achieved a ‘Good Level of Development’ at the end of EYFS (0%) compared to 75% of those not in receipt of pupil premium. By 2025, the percentage of pupils in receipt of pupil premium who achieved a ‘Good Level of Development’ had risen to 50%. 84.2% of pupils not in receipt of pupil premium achieved a ‘Good Level of Development’. End of Key stage 2 results in 2024 showed 50% of pupils in receipt of pupil premium achieved ARE+ in RWM combined, compared to 68% of pupils not in receipt of pupil premium funding. In 2025 the results showed that 60% of pupils in receipt of pupil premium achieved ARE+ in RWM combined, compared to 52.6% of pupils not in receipt of pupil premium. |
||||||||||||||||
|
3 |
Addressing non-academic barriers to attainment such as self-regulation, learning resilience and other behaviours for learning Our assessments, observations and discussions with teachers, families and pupils have identified a regression in pupils’ abilities to self-regulate and approach learning with resilience. Pupil Attitude to Self and Score Survey (PASS Survey) scores show an average of 41.8 for non-disadvantaged pupils but an average of only 25.7 for disadvantaged pupils (January 2025). |
||||||||||||||||
|
4 |
Meeting the Special Educational Needs of disadvantaged pupils A higher proportion of disadvantaged pupils also have identified SEND compared to non-disadvantaged pupils. This high level of SEND need amongst the disadvantaged cohort provides an extra level of challenge for these pupils in terms of their progress and in meeting age related expectations. (27/120) 22.5% of non-disadvantaged pupils have SEND needs (Dec 2025). (6/17) 35.5% of disadvantaged pupil have SEND needs (Dec 2025). |
||||||||||||||||
|
Ensuring additional enrichment opportunities are accessible for disadvantaged pupils as well as their peers Autumn term 2024 data shows that 5.2% of pupils in receipt of PPG have attended extra-curricular (paid for) clubs compared to 91% of non-PPG. This is an increase from 2023 of +3.06% but still a significant gap. In Autumn Term 2025, 76.5% of pupils in receipt of PPG have attended extra-curricular (paid for) clubs, a significant increase. 83.3% of non-PPG pupils have attended extra-curricular (paid for) clubs. Young Voices Trip (January 2025), 77% of non-disadvantaged pupils attended compared to 0% of disadvantaged pupils. During the Autumn Term 2025, the school trips for Reception Class, Year One and Years Five and Six were each attended by 100% of both PPG and non-PPG pupils. |
Intended outcomes
This explains the outcomes we are aiming for by the end of our current strategy plan, and how we will measure whether they have been achieved.
|
Intended outcome |
Success criteria |
|
The attainment gap between disadvantaged pupils and their peers decreases |
The number of disadvantaged EYFS children achieving GLD is at least in line with the national average. EYFS outcomes between 2024 and 2028 show the gap between the number of disadvantaged pupils achieving GLD compared to their peers has reduced. KS1 and KS2 outcomes between 2024 and 2028 show attainment of our pupil premium pupils is at least in line with the national average. KS1 and KS2 outcomes between 2024 and 2028 show the gap in attainment of our pupil premium pupils compared to their peers has reduced. |
|
Pupils receiving targeted academic support with make accelerated progress compared to their peers |
Academic outcomes in R, W and M for children receiving targeted academic support, such as 1:1 tuition, small group interventions, pre/post teaching, booster groups etc, shows they make accelerated progress compared to their peers. |
|
Disadvantaged pupils are identified on class intervention trackers and data shows appropriate interventions with improved outcomes |
All interventions have a positive impact on children’s learning. All children are clear on what they need to do to improve their learning. Support staff deliver high-quality, targeted interventions. Staff can identify and implement the most effective intervention. Provision maps and ONE Plans evidence a robust system of assess, plan, do, review being implemented across the school. |
|
Disadvantaged pupils are added to the Pastoral Register with any appropriate pastoral interventions having a positive impact |
Intervention tracking data shows a positive impact and improved scores using the 6 Core Strengths assessment. Disadvantaged pupils have attended pastoral interventions such as therapeutic forest school and their self-assessment scores show an increase over the weeks. |
|
Disadvantaged pupils with special education needs make progress across the curriculum particularly in core subjects |
Disadvantaged SEND pupils’ EYFS, KS1 and KS2 outcomes between 2024 and 2028 show attainment and progress is at least in line with the national average. Disadvantaged SEND pupils’ EYFS, KS1 and KS2 outcomes between 2024 and 2028 show the gap in attainment compared to their peers has reduced. |
|
Personal finance is not a barrier to full participation in school life including trips, visits and extra-curricular activities. |
An increased number of families are aware of our pupil premium offer and the number of pupils in receipt of pupil premium funding has increased. All children participate in school visits. The number of disadvantaged pupils having music lessons has increased. The number of disadvantaged pupils attending extracurricular clubs and activities has increased. All disadvantaged children have correct school uniform provided for them. |
Activity in this academic year
This details how we intend to spend our pupil premium (and recovery premium funding) this academic year to address the challenges listed above.
Teaching (for example, CPD, recruitment and retention)
Budgeted cost: £7,682.90
|
Activity |
Evidence that supports this approach |
Challenge number(s) addressed |
|
Training all teachers and support staff to ensure systematic and consistent teaching of transcription skills across the school |
NLM – The Impact of Transcription Writing Interventions Wanzec et al (2018) The Impact of Transcription Writing Interventions for First-Grade Students - PMC Research Review Series: English OFSTED (2022) Research review series: English - GOV.UK DFE Writing Framework (2025) The writing framework - GOV.UK ‘Grammarsaurus’ subscription for access to their English curriculum = £270 |
1 2 4 |
|
Trauma Perceptive Practice Training for all staff |
Social and Emotional Learning Social and emotional learning | EEF Implementation cost £££££ Evidence strength ***** Impact (months) +4 months A Trauma Perceptive Practice approach (TPP) is a whole school approach to understanding behaviour and supporting emotional wellbeing. It provides the foundations where everyone feels physically and emotionally safe; the approach is one that encourages high structure and high nurture, where relationships matter and caring counts. Children, young people and staff alike feel connected to the school and to each other. TPP is a journey and evolution. Our mission is to ground TPP in living and learning and as such we have developed a new professional development programme called Ready to Regulate (R2R). School staff’s understanding and perceptions of trauma-informed practice and the barriers to implementing this at a whole-school level: A grounded theory exploration. Cost of all staff attending x 2 6.5 hours training = £3985.28 Cost of access to TPP Hive Platform x 3 (£25) = £75 |
3 4 |
|
Ready to Regulate Training focused on empowering adults in schools with the knowledge and practical skills to respond to dysregulation and support regulation |
Social and Emotional Learning Social and emotional learning | EEF Implementation cost £££££ Evidence strength ***** Impact (months) +4 months A professional learning programme for adults working directly with children and young people. Empowering adults in schools with the knowledge and practical skills to respond to dysregulation and support regulation. Cost of 2 x TAs covered for 3 x days training each (6 x 6.25 hours) = £707.25 TA funded to run Drawing and Talking sessions for 1.5 hours per week supporting pupils across the school with a specific focus on disadvantaged pupils (1.5 TA hours per week x 38 weeks) = £1,075.02 |
3 4 |
|
Use school led tuition and recovery funding to provide small group interventions focusing on key Maths skills (EPS Maths Intervention) |
Teaching Assistant Interventions | EEF Implementation cost £££££ Evidence strength ***** Impact (months) +4 months The EPS Maths Intervention (EPS MI) is a programme of number-based learning sessions designed to boost and secure the basic number skills expected in Key Stage 1. The content and delivery of the programme has been developed from evidence-based psychological research. The programme has successfully been used with pupils from Key Stage 1 to Key Stage 4. The EPS MI is a 12 week programme which will increase pupils’ arithmetical skills. On average pupils make double the rate of progress on standardised assessments when compared to the progress made by pupils not using the intervention - see the peer reviewed research journal publication article: Ros Somerville, Kate Ayre, Daniel Tunbridge, Katy Cole, Richard Stollery & Mary Sanders (2015) Firm foundations: the effectiveness of an educational psychologist developed intervention targeting early numeracy skills, Educational Psychology in Practice, 31:3, 265-278. Cost of EPS maths course = £160 Cost of 1 x TA cover for 1.5 days training and coaching (1.5 x 6.25 hours) = £176.81 Cost of SENCO cover for 1.5 days training and coaching (1.5 x 6.25 hours) = £528.66 |
|
|
SENCO to attend Using Metacognition and Memory to Boost Attainment training and disseminate content to teaching and support staff.
|
Metacognition and self-regulation | EEF Implementation cost £££££ Evidence strength ***** Impact (months) +8 months Cost of SENCO cover for 2 days training and coaching (2 x 6.5 hours) = £704.88 |
1 2 4 |
Targeted academic support (for example, tutoring, one-to-one support structured interventions)
Budgeted cost: £8,005.45
|
Activity |
Evidence that supports this approach |
Challenge number(s) addressed |
|
Use school led tuition and recovery funding to provide small group interventions focusing on key English skills |
Implementation cost £££££ Evidence strength ***** Impact (months) +4 months Reading comprehension strategies | EEF Implementation cost £££££ Evidence strength ***** Impact (months) +6 months TA funded to be a ‘Reading Champion’ for 1.5 days per week supporting pupils across the school with a specific focus on disadvantaged pupils (6.75 TA hours per week x 38 weeks) =£4,837.59 Teaching Assistant Interventions | EEF Implementation cost £££££ Evidence strength ***** Impact (months) +4 months |
1 2 4
|
|
Use school led tuition and recovery funding to provide small group interventions focusing on key gross and fine motor skills (Gym Trail) |
Teaching Assistant Interventions | EEF Implementation cost £££££ Evidence strength ***** Impact (months) +4 months Cost of 2 x TA cover for 1 hour training (2 x 1 hour) = £39.89 2 x TAs funded to run Gym Trail (2 x 3 x 20 mins per week = 38 weeks) = £1515.82 |
1 2 4 |
|
Use school led tuition and recovery funding to provide small group interventions focusing on key oral and social interaction skills. |
Oral language interventions | EEF Implementation cost £££££ Evidence strength ***** Impact (months) +6 months ELKLAN and WellComm trained TA offering daily SALT interventions across EYFS and KS1 (2.5 TA hours per week x 38 weeks) = £1612.15 |
1 2 4
|
Wider strategies (for example, related to attendance, behaviour, wellbeing)
Budgeted cost: £6,243.00
|
Activity |
Evidence that supports this approach |
Challenge number(s) addressed |
|
Pastoral and Behaviour Support Lead to be in place providing individual and small group sessions for identified pupils. |
Social and emotional learning | EEF Implementation cost £££££ Evidence strength ***** Impact (months) +4 months Implementation cost £££££ Evidence strength ***** Impact (months) +4 months Pastoral and Behaviour Support Lead 1.5 hours/ week (Therapeutic Forest School) = £1193 |
1 3 4 |
|
Provide enrichment opportunities for all pupils to increase aspirations, engagement, and enjoyment. This may be, but not limited to, funding music lessons, extra-curricular clubs and trips. |
Implementation cost £££££ Evidence strength ***** Impact (months) +3 months Arts participation and experiences rich in language can increase confidence and engagement of all pupils and narrow the disadvantage gap. Funding for each PPG child of £6 per week to attend an extra -curricular activity or towards the cost of music tuition 38 weeks x £6 = £228 per child per year. £228 x 10 = £2280.00 |
5 |
|
Provide wraparound care for disadvantaged pupils to enable parents to work and support disadvantaged children to access extracurricular activities to improve their outcomes. |
Microsoft Word - Wraparound childcare insight report FINAL Insights into wraparound childcare report from Coram Family and Childcare (January 2024) Funding for each PPG child of £6 per week to attend wraparound care 38 weeks x £6 = £228 per child per year. £228 x 10 = £2280.00 |
5 |
|
Provide school uniform and PE kit for disadvantaged pupils to ensure they feel prepared, comfortable and ready for learning. |
https://www.unr.edu/nevada-today/news/2013/school-uniform-study Although 90 percent of the students indicated they did not like wearing uniforms, various benefits to wearing uniforms were reported, including decreases in discipline, gang involvement and bullying; and increases in safety, ease of going to school, confidence and self-esteem. Uniform costs for 1 set of school uniform and PE kit per PPG child (£49 per child x 10 PPG pupils) = £490 |
3 5 |
Total budgeted cost: £12,305
£7,682.90 + £8,005.45 + £6,243.00 = £21,931.35
(-£9,626.35 overspend to come from school budget)
Part B: Review of outcomes in the previous academic year
Pupil premium strategy outcomes
This details the impact that our pupil premium activity had on pupils in the 2023 to 2024 academic year.
|
Aim |
Evaluation |
|
The attainment gap between disadvantaged pupils and their peers decreases |
Closing the attainment gap between disadvantaged pupils and their peers EYFS · In 2023-2024, 25% of PPG pupils achieved a Good Level of Development compared to 75% of non-PPG. GAP = -50%. · In 2024-2025, 50% of PPG pupils achieved a Good Level of Development compared to 84% of non-PPG. GAP = -34%.
KS1 · 2020-2021 End of KS1 results for disadvantaged pupils were below non-disadvantaged in all core subjects (Reading gap -35%, Writing gap -70%, Maths gap -75%). · 2021-2022 No PPG children in End of KS1 results. · 2022-2023 No PPG children in End of KS1 results. · 2023-2024 No PPG children in End of KS1 results. · 2024-2025 No PPG children in End of KS1 results.
KS2 · 2020-2021 End of KS2 results for disadvantaged pupils in Writing were below non-disadvantaged pupils (gap -86%). · 2021-2022 End of KS2 results for disadvantaged pupils was higher than that of their peers (RWM Combined 100% for PPG pupils compared to 86% for non-PPG). GAP = +14%. · 2022-2023 End of KS2 results for disadvantaged pupils was higher than that of their peers (RWM Combined 100% for PPG pupils compared to 19% for non-PPG). GAP = +81%. · 2023-2024 End of KS2 results for disadvantaged pupils was below that of their peers (RWM Combined 50% for PPG pupils compared to 68% for non-PPG). GAP = -18%. · 2024-2025 End of KS2 results RWM combined for disadvantaged pupils was below that of their peers (50% for PPG compared to 55% for non-PPG). However, the gap has narrowed compared to the previous year GAP = -5%. |
|
The progress gap between disadvantaged pupils and their peers decreases |
Providing targeted academic support for pupils who are not making the expected progress · 2021-2022 The number of disadvantaged pupils achieving ARE in Reading, Writing and Maths was below their peers o (Reading -35%, Writing -57% and Maths -39%). · 2022-2023 The gap between the number of disadvantaged children achieving ARE compared to their peers has decreased in all core subjects o (Reading -14%, Writing -13% and Maths -23%) · 2023-2024 The gap between the number of disadvantaged children achieving ARE compared to their peers has decreased in all core subjects o (Reading –1%, Writing –8% and Maths –17%) · 2024-2025 The gap between the number of disadvantaged children achieving ARE compared to their peers has increased in all core subjects o (Reading –22%, Writing –29% and Maths –26%) |
|
The gap in rates of unauthorised absence between disadvantaged pupils and their peers decreases |
Addressing non-academic barriers to attainment such as attendance and behaviour · 2020-2021 attendance data shows disadvantaged pupils have higher rates of unauthorised absence o (0.6% compared to 0.1% for non-disadvantaged). · 2021-2022 attendance data shows disadvantaged pupils had lower rates of unauthorised absence o (0.5% compared to 0.7% for non-disadvantaged). · 2022-2023 attendance data shows disadvantaged pupils have lower rates of unauthorised absence o (0.4% compared to 1.1% for non-disadvantaged). · 2023-2024 attendance data shows disadvantaged pupils have higher rates of unauthorised absence o (3.51% compared to 0.38% for non-disadvantaged). o GAP = -3.13% · 2024-2025 attendance data shows disadvantaged pupils have higher rates of unauthorised absence o (2.22% compared to 0.9% for non-disadvantaged). o GAP = -1.32% |
|
Vulnerable learners are identified and provision maps show appropriate interventions with improved outcomes |
Ensuring staff are able to correctly identify vulnerable learners and have the skills to address their needs Improved consistency in provision for vulnerable learners across the school as evidenced by monitoring information including lesson observations, provision maps, interviews with staff/pupils, work scrutinies etc. This has been achieved through quality CPD, coaching for staff and development of the senior leadership team. |
|
Disadvantaged pupils with special education needs make progress across the curriculum particularly in core subjects |
Meeting the Special Educational Needs of disadvantaged pupils December 2021 - A higher proportion of disadvantaged pupils also have identified SEND compared to non-disadvantaged pupils (43% of PP children have SEND whereas 12.5% of non-PP children have SEND). December 2022 – A higher proportion of disadvantaged pupils also have SEND but this has decreased from last year (30% of PP children have SEND). December 2023 – 30% of disadvantaged pupils also have SEND compared to 11% of non-disadvantaged pupils. December 2025 – 35.3% of disadvantaged pupils also have SEND, compared to 21.6% of non-disadvantaged pupils. |
|
Personal finance is not a barrier to full participation in school life including trips, visits and extra-curricular activities. |
Extra-curricular and enrichment uptake shows that fewer disadvantaged pupils access paid for clubs and activities · Spring term 2022 data shows of 111 attended club places, only 1/111 (0.9%) is a disadvantaged pupil. ü Autumn term 2022 data show of 199 club places, 7/199 (3.5%) were disadvantaged pupils. This is an increase +2.6%. · Autumn term 2023 data shows that only 2.14% of extracurricular club spaces were taken by Pupil Premium children. This is a decrease of -1.36% of all club spaces. ü Autumn term 2024 data shows that 5.2% of pupils in receipt of PPG have attended clubs compared to 91% of non-PPG. This is an increase from 2023 of +3.06%. · Autumn Term 2025 data shows that 3.9% of pupils in receipt of PPG have attended clubs compared to 93.1% of non-PPG. |